


One of the questions I ask new clients when I start working with them is: how do you define success? I get a lot of “hm, I’m not sure” or “Not as clearly as I’d like” quips before we dig into what great looks like; that’s because the vast majority can’t answer it cleanly.
Why? Because onboarding sits in that awkward organizational space where everyone is involved and no one’s accountable to the measurement – and that gap has a cost!
When you can’t quantify what better employee onboarding returns, you can’t justify investing in it. So, this guide walks through how to calculate your onboarding ROI in practical, defensible terms … including costs most organizations miss, metrics that matter, and how to translate all of it into a number you can take to a CFO with confidence.
Ready? Let’s dive in, or if you’d rather jump right to it, try our onboarding & offboarding ROI calculator yourself.
- Why calculating this matters
- How to calculate it
- Key metrics to measure
- Two examples: manual and HRIS module
- Demonstrate it yourself
The basic onboarding ROI formula:
Onboarding ROI (%) = ((Total Gains from Onboarding − Total Cost of Onboarding) ÷ Total Cost of Onboarding) × 100
Seems simple? There’s your problem; the tension lies in deciding what falls into “total gains” or “total costs.” I see global organizations undercount both the cost of their onboarding process and the gains that a well-structured program delivers.
If you’re not sure what to fit in, you can always read more about what onboarding actually is first, then come back here!
Why taking the time to calculate onboarding ROI matters
The business case for onboarding investment is well-established in the research ,but it’s frequently invisible at the organizational level because the costs and returns are distributed across departments, timelines, and budget lines that don’t typically talk to each other.
Organizations with structured onboarding programs see 82% higher new hire retention and 70% greater productivity among new hires, and replacing an employee who leaves early can rise as high as 150% depending on seniority and specialization.
Significant? Yes … but they’re only actionable when connected to your hiring volume, average salary, timing, processes, and turnover rates. In other words, stats are just that unless they’re applied contextually, but that application is how you position HR as a strategic investment vs. being a cost center.
Identify the total cost of onboarding
What is the ROI of onboarding? At its core, it’s the financial return generated by retaining employees longer, getting them productive faster, and avoiding the compounding costs of early exits. But it also includes harder-to-quantify returns: reduced compliance risk, stronger employer brand, and the long-term value of employees who stay through their first year and beyond.
Accurate ROI calculation starts with an honest accounting of what onboarding actually costs.
We built ROI metrics directly into our platform because we found that when clients don’t know how they’re defining success, they’re probably not investing in it. Showing them “here’s your no-show rate, here’s your time-to-productivity trend,” etc. gives them something concrete to act on.
Most organizations track only the most visible expenses, such as training costs or HR’s time, and miss the hidden costs that often dwarf them. Both need to be in your denominator!
Direct costs
Direct costs are the expenses that appear on a budget line and are relatively easy to identify:
| Cost category | What to include | Typical range |
| Recruitment | Job board fees, agency fees, background checks, assessments | $4,700 average cost-per-hire (SHRM 2025) |
| HR administration | Time spent processing documentation, coordinating orientation, managing compliance paperwork | Varies; typically 8–15 hours per hire |
| Technology and platform | HRIS, onboarding software, e-signature tools, LMS licenses | Per-seat or per-hire depending on vendor model |
| Training and orientation | Trainer time, learning materials, role-specific certification costs | Varies significantly by role complexity |
| Equipment and provisioning | Hardware, software licenses, access credentials, office setup | $500–$5,000+ depending on role and location |
Hidden costs
Hidden costs are the expenses that rarely appear on a budget line but represent a significant proportion of the true cost of onboarding … and the true cost of onboarding failure:
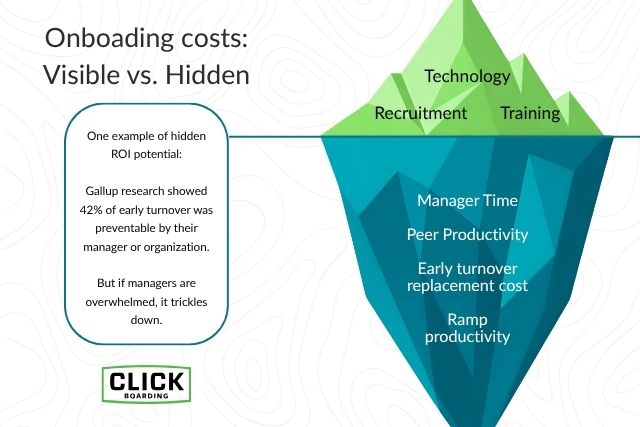
- Manager time. The hours a hiring manager spends onboarding a new hire (answering questions, reviewing work, attending introduction meetings, prep work in advance) are rarely tracked but consistently significant. Research suggests managers spend 10–20% of their time on new hire support in the first 90 days.
- Lost productivity during ramp. Every new hire operates below full productivity while they’re getting up to speed. During that period, the organization is paying full salary while receiving partial output. For a $70,000 role, that gap can represent $15,000+ in productivity!
- Peer productivity drag. When new hires need support from teammates, it slows the entire team down; for global enterprises, that quickly adds up.
- Early turnover replacement cost. If a new hire exits within 90 days, every dollar spent on their recruitment and onboarding is wasted. At 50-200% of annual salary per replacement (per SHRM and Gallup), this is typically the largest single hidden cost in a poorly performing onboarding program.
- Compliance exposure. Fines for missed compliance requirements, such as I-9 verification errors and state-mandated notice failures, are rarely factored into onboarding cost models until they actually occur.
Measuring onboarding success: the key metrics
Every critical metric has a financial impact, so going beyond the surface-level number and tying it to dollars is important. Need examples? See how Click Boarding clients have fared!
Retention rate and early turnover
Retention is the most direct expression of onboarding ROI. A new hire who stays through their first year represents the full return on your recruitment and onboarding investment. One who leaves in the first 90 days represents a near-total loss of that investment, plus the cost of starting again.
One benchmark: organizations with structured onboarding see 58% of new hires remain with the company after three years, compared to 33% for companies with weak onboarding programs. That’s a 25-percentage-point gap … and it’s often lost when discussing onboarding KPIs!
How to calculate it: Take your early turnover rate (exits within 90 days as a percentage of total hires), multiply by your average replacement cost (conservatively 50% of annual salary), and that gives you your current cost of early attrition. What does a 10% improvement here look like? There’s a defensible ROI number!
Retention ROI:
Annual retention savings = (Current early exit rate − Target early exit rate) × Annual hires × Average replacement cost
Time to productivity
Time to productivity measures how long it takes a new hire to reach the performance level expected of someone fully in role. It’s one of the clearest expressions of onboarding efficiency and one of the most directly translatable to financial terms.
That can be a couple of months, or longer, depending on the type of role. For clerical roles it’s typically around 8 weeks; for professional roles, it’s often 2-3x longer, with more for executives. You’re paying full price for less than 100% productivity, so any way to shorten this gap is a win for the business.
How to calculate it: What percentage of full output is a new hire delivering as they onboard? You can estimate this, then multiply that gap by the weekly salary cost and the ramp duration to get your productivity loss per hire.
Reducing ramp time by even two weeks across 200 annual hires at $1,400/week produces $560,000 in recovered productivity.
“One of our core ROI metrics is speed to productivity; specifically, shaving time off how long it takes someone to become fully effective. When we can get that from three hours of scattered onboarding to 20 minutes of focused, digital-first onboarding, that multiplies across every hire you make in a year and means dollars saved for the business.”
Nick Kollinger, Head of Product
No-show rate
No-shows are candidates who accept an offer but don’t appear on Day 1, and the ghosting trend is growing. When you’re left with an empty role, it’s a total loss of recruitment efforts.
This metric’s often tracked in isolation by talent acquisition but rarely factored into onboarding (and/or preboarding) calculations, even though structured preboarding is the most direct intervention available to reduce it.
How to calculate it: Multiply your current no-show rate by your average cost-per-hire. If you hire 200 people per year, have a 10% no-show rate, and your cost-per-hire is $4,700, that’s $94,000 in recruitment spend that produces zero return. Reducing no-shows by half saves $47,000!
No-show cost = Annual hires × No-show rate × Cost-per-hire
HR administrative time
Administrative efficiency is the ROI metric that resonates most clearly with operations leaders and CFOs. Every hour an HR team member spends manually chasing paperwork, re-sending forms, or following up on provisioning requests is an hour not spent on strategic work — and an hourly labor cost that can be calculated precisely.
How to calculate it: Track the average HR hours spent per hire on administrative onboarding tasks. Multiply by your average HR hourly labor cost, and then put in a defensible amount of hours saved per person … that’s your administrative efficiency ROI.
Annual admin savings = (Hours per hire × Hourly HR cost × Annual hires) × Automation reduction rate
“When clients automate their onboarding workflows, the first thing they notice isn’t a stat — it’s time. HR recovers hours they were spending on follow-up and compliance chasing. Those hours go back into work that actually matters: engaging new hires, building culture, solving problems.”
Adam Wachtel, Chief Technology Officer
Real-world onboarding ROI: two examples
You likely fall into one of these: either manually chasing process or working around a clunky HRIS onboarding module.
Let me start with the first:
A mid-size organization with a high-volume hiring process came to us with a problem that’s common: onboarding was taking close to three hours per new hire, spread across multiple days and multiple people’s time. Forms were incomplete, IT access was delayed, and managers were fielding the same questions repeatedly because nobody had a clear picture of where each new hire was in the process.
After implementing Click Boarding, their onboarding time dropped to 20 minutes. The gains were financial and measurable across every dimension we’ve covered in this guide.
Manual intervention
Let’s say you hire 500 hires per year with an average salary of $60,000.
Starting assumptions, which I’ll note are actually conservative based on available research:
- Current onboarding admin time per hire: 8 hours total labor (HR + manager)
- Current early attrition rate (within 90 days): 10%
- Current no-show rate (accepted offer, no start): 5%
- Average time-to-full-productivity: 10 weeks, with a 20% productivity gap during ramp
- Average HR hourly cost: $35 | Average manager hourly cost: $50
- Replacement cost assumption: 50% of annual salary*
*this is the conservative floor of a 50–200% range cited by both SHRM and HBR.
After structured, automated onboarding and assuming modest improvements:
- Admin labor reduced by 40% (documented digital workflows): $355/hire × 500 hires × 40% = $71,000
- Early attrition reduced from 10% to 5% (5-point improvement): 5% × 500 hires × $30,000 replacement cost = $750,000
- No-show rate reduced from 5% to 3% (2-point improvement): 2% × 500 hires × $4,700 cost-per-hire = $47,000
- Time-to-productivity improved by 1 week (20% productivity gap): 1 week × $1,154/week × 20% × 500 hires = $115,400
Total estimated annual savings: approximately $983,000
Let’s say you spend $150,000 to get these improvements, then the ROI is 555% … put another way, for every dollar you spent, you’ve returned $6.55 of value to the business.
That’ll get Finance’s attention!
The “clunky” HRIS module
Now, let’s say you’re already automating some of your onboarding – or at least, as much as you can. You’re using your HRIS’ built-in module, which many do today looking for that all-in-one experience.
We hear it’s a “clunky” experience for many candidates and HR teams, often needing IT’s involvement to make updates. Every form update, new-location rollout, or workflow change required submitting a ticket and has 2-3 week turnarounds.
So, what to do? Either wait … or build a workaround. Neither works at scale.
“I come from a benefits technology background. The question is always, I’’m already paying for the all-in-one, why do I pay for you too?’ What we’ve always said is: the all-in-ones do everything … but nothing in particular.”
Adam Wachtel, Chief Technology Officer
“It’s technically covered” and “this is working” is where your ROI lives, so let’s walk through it:
Assumptions:
500 hires/year
$60,000 average salary
Starting assumptions:
- Onboarding-related IT change requests: 12/year (1 a month)
- Average IT resolution time per ticket: 15 business days
- IT labor per ticket: 3 hours at $50/hour
- HR workaround labor during the wait: 30 minutes/day × 15 days = 7.5 hours at $35/hour
- Early attrition rate: 8%
- No-show rate: 4%
- Time-to-productivity gap: 10 weeks, 20% productivity gap
- Replacement cost: 50% of salary*
*again, this is the low end of the range cited by SHRM and HBR.
Here’s what you gain by moving to a purpose-built, self-service platform:
IT ticket cost elimination: 12 tickets x $150/hr IT cost + $262.50 in HR workarounds = $4,950
Early attrition reduced from 8% to 5% due to superior experiences, including preboarding: 3% reduction x 500 annual hires x 50% of average salary spent on re-hiring = $450,000
Productivity, saving just 30 mins a week per onboard, nets you another $57,700.
And assuming a slight improvement in new hire no-shows (down to 3% from 4%) saves another $23,500.
All total? $536,000 … a 3.6x return on that same $150,000 investment – but if you’re hiring 500 people a year, it doesn’t cost nearly that much!
Go ahead, do your own math! Or, take a quick pass with our ROI calculator.
Demonstrate your onboarding ROI
You need to show what “better” looks like for your organization and how that ROI looks on an everyday basis; this is how an investment case becomes clearer. An added benefit? It’s what’s needed to turn HR into a strategic partner for business outcomes instead of being seen as a cost center that’s a “necessary evil.”
We both know HR has amazing potential to help the business and its people! It’s why you’re in the field to begin with, so you should be respected for the value you actually provide … and it’s far more than is typically thought of.
Here’s few principles for making onboarding ROI defensible and repeatable:
- Establish a baseline before you change anything. You can’t demonstrate improvement without a starting point, so track your current no-show rate, 90-day retention rate, average ramp time, and HR hours per hire before implementing any new process or platform … yes, even Click Boarding.
- Connect metrics to dollar values. Asking “what’s the business impact of this?” turns something like retention rate, which is interesting but just a stat on its own, into “we saved $1.8Mby reducing early exits.”
- Report at regular intervals. Build a quarterly or annual reporting cadence that tracks the metrics over time and shows trend direction. What’s the trendline? That’s the story to tell to the C-suite.
- Attribute results to specific changes. If you implement a structured preboarding workflow and your no-show rate drops, connect them; activities (“stuff you did”) alone don’t move the needle, but tying them to impact does and makes it easier for leaders to want to invest in what you know matters.
Measurement must be part of your process, and great companies have HR teams that know their numbers and use them to drive continuous improvement.
If you’re ready to start building that, our onboarding platform includes built-in reporting on the metrics that matter most, from no-show rates, process completion, time-in-workflow, and more around the KPIs mentioned above.
Because ROI should be standard.